Chart Geany
- Developer: Lucas Tsatiris
- Home page: www.chartgeany.com
- License type: Commercial
- Size: 11.72 MB
- Download
Review
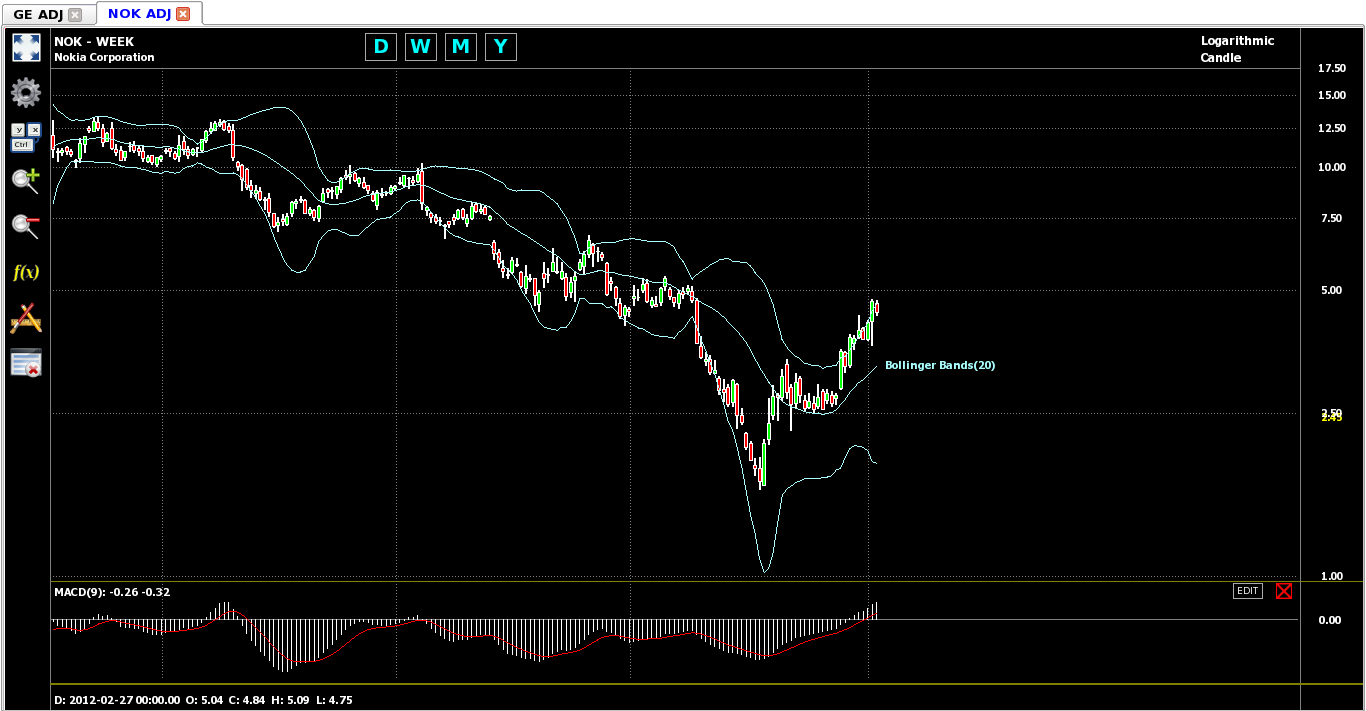
Chart Geany is a cross platform software solution for market technical analysis and charting. Compatible with stocks, mutual funds, futures, indices. Major technical analysis indicators: Simple Moving Average, Exponential Moving Average, MACD, Fast and Slow Stochastics, Money Flow Index, Rate of Change, Relative Strength Index, Williams %R, Bollinger Bands, Parabolic SAR and Average Directional Index. Tab-based graphical user interface. You can manage the opened charts the same way you manage the open pages of your web browser. Drawing and text objects: Labels, Trailing Text (a label attached to specific date), Horizontal Lines, Vertical Lines, Trend Lines and Fibonacci Retracements. Line, Bar, Candle and Trend Candle (Heikin-Ashi) charts. Linear or semi-logarithmic price scaling. Zoom In and Zoom out. Time-frames: Day, Week, Month and Year. Comma Separated Values (CSV) files can be imported through the CSV Manager. Most common formats are supported like Metastock 7, Metastock 8 and AMI Broker. Easy download of quotes from Yahoo Finance or Google Finance. One click screen shots for charts. Spreadsheet-like data manager. Single file local storage. You can work offline if needed.