Graphical Execution Plan Viewer for Oracle Databases
- Category
- Utilities
- System Analysis Utilities

- Developer: Tilo Hegel
- Home page: www.epviewer.bplaced.net
- License type: Free
- Size: 2.02 MB
- Download
Review
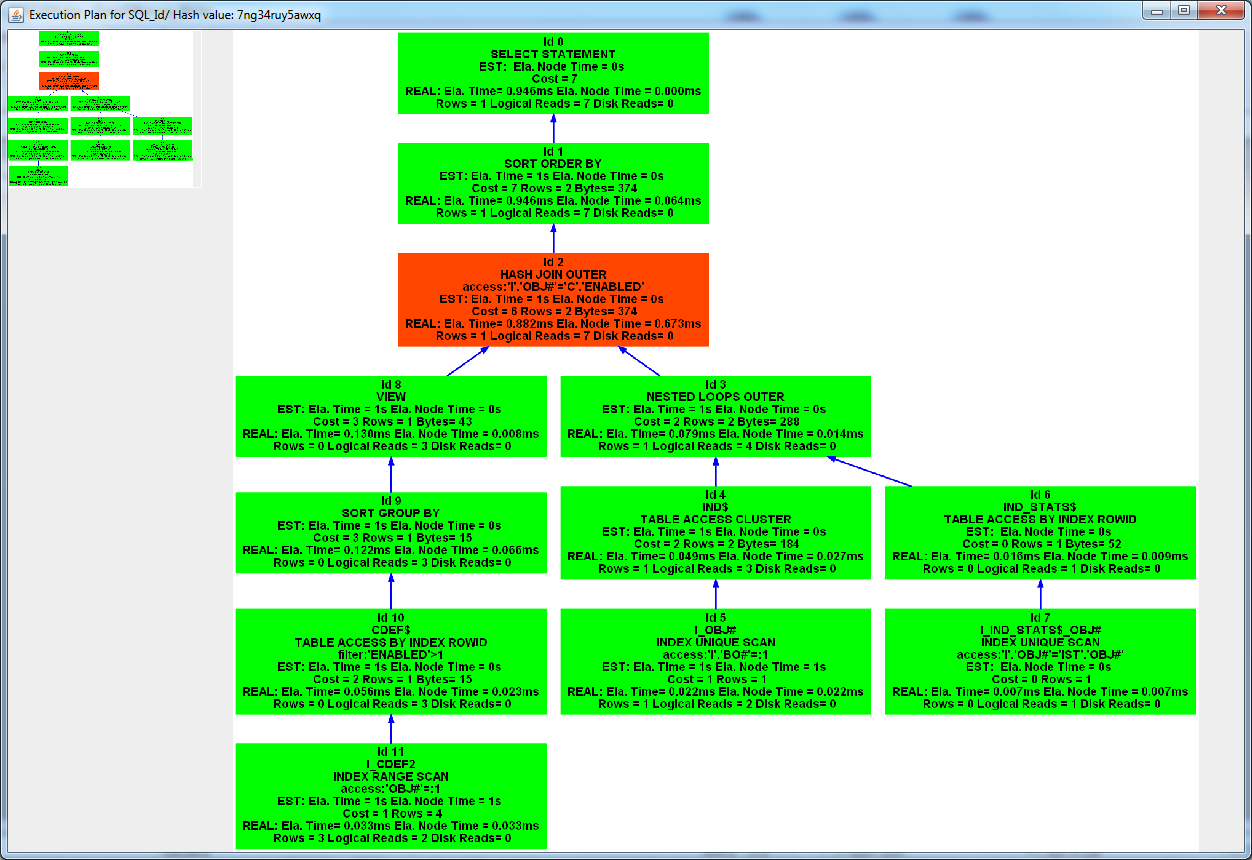
As one important new feature epviewer calculates and displays the Elapsed node time (estimated and real) which contains only the Elapsed time of the actual operation without the elapsed time for the child nodes. Therefore epviewer can highlight expensive operations and you see very fast and very rapidly which steps of the execution plan are most expensive. Another new feature is the easy possibility to interactive zoom in and out of the Execution plan using the mouse scroll wheel and to navigate inside of the Execution plan. The Graphical Execution (Explain) Plan is much easier to read and to understand than the tabular executing plan representation provided by the Oracle function DBMS_XPLAN.DISPLAY. In the tabular representation it is difficult to understand the execution order for the various steps especially for a complex execution plan. In the graphical execution plan using epviewer filter and access predicates are displayed into the operation step information directly; in the tabular execution plan these predicates are referenced by an operation id link. Epviewer can display V$SQL_PLAN_STATISTICS_ALL data, that contains beside the estimated values real execution values from the last execution too. With epviewer you are able to create an execution plan from various plan table sources (V$SQL_PLAN_STATISTICS_ALL including V$SQL_PLAN, STATS$SQL_PLAN(_USAGE), DBA_HIST_SQL_PLAN, plan_table for the Complete SQL Input) for a given SQL_ID or Hash Value. Epviewer highlights the most expensive operations/ nodes. If row source execution statistics are available, epviewer highlights the nodes with expensive real/ last elapsed times, otherwise epviewer highlights the nodes with the expensive estimated times. So you see very fast and very rapidly which steps of the execution plan are most expensive especially if the Execution plan contains many nodes. For more details see http://www.epviewer.bplaced.net/wp-content/uploads/2012/01/Readme_epviewer.pdf