Planet's Visibility
- Category
- Business
- Educational Tools
- Developer: Rainer Lange
- Home page: www.alcyone.de
- License type: Free
- Size: 5.22 MB
- Download
Review
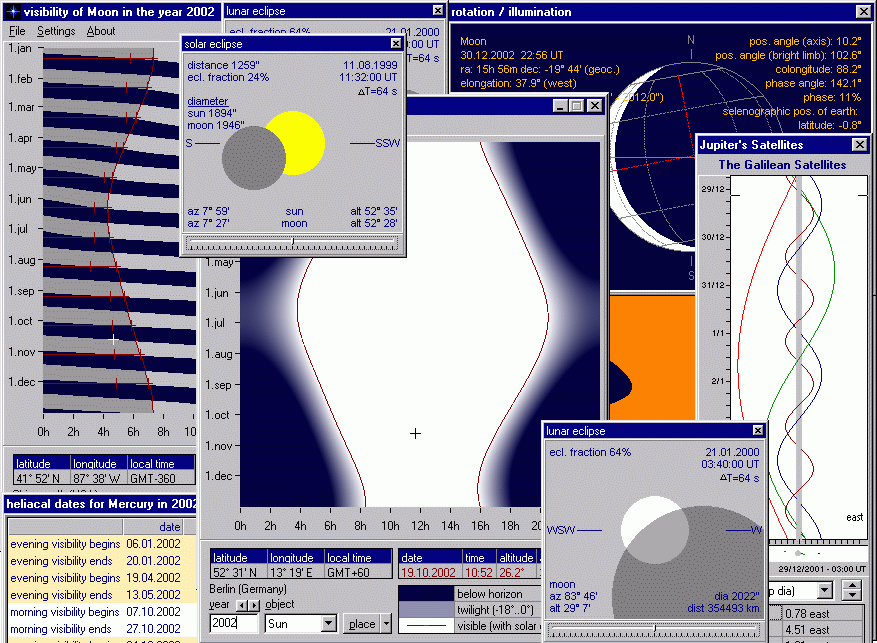
Planet’s Visibility presents a 3-color graph that shows when a planet, the moon or the sun is visible during any year from 3000 BC to AD 6000 at any location on the earth. The vertical axis marks the months of the year, the horizontal axis marks the hours of the day. The three colors create a contour map effect and show whether the body is under the horizon and invisible, above the horizon with the sun and invisible, above the horizon without the sun and so possibly visible. By moving the mouse over the diagram, the date and time along with the object’s altitude, azimuth, and magnitude, or the phase of the moon, are displayed. In addition, Planet’s Visibility computes the dates of visibility phenomena, first and last visibility, acronychal rising and cosmical setting, with much supplementary information. These phenomena are very useful for historical purposes. There are also diagrams of solar and lunar eclipses, of the rotation, inclination, and illumination of the bodies.