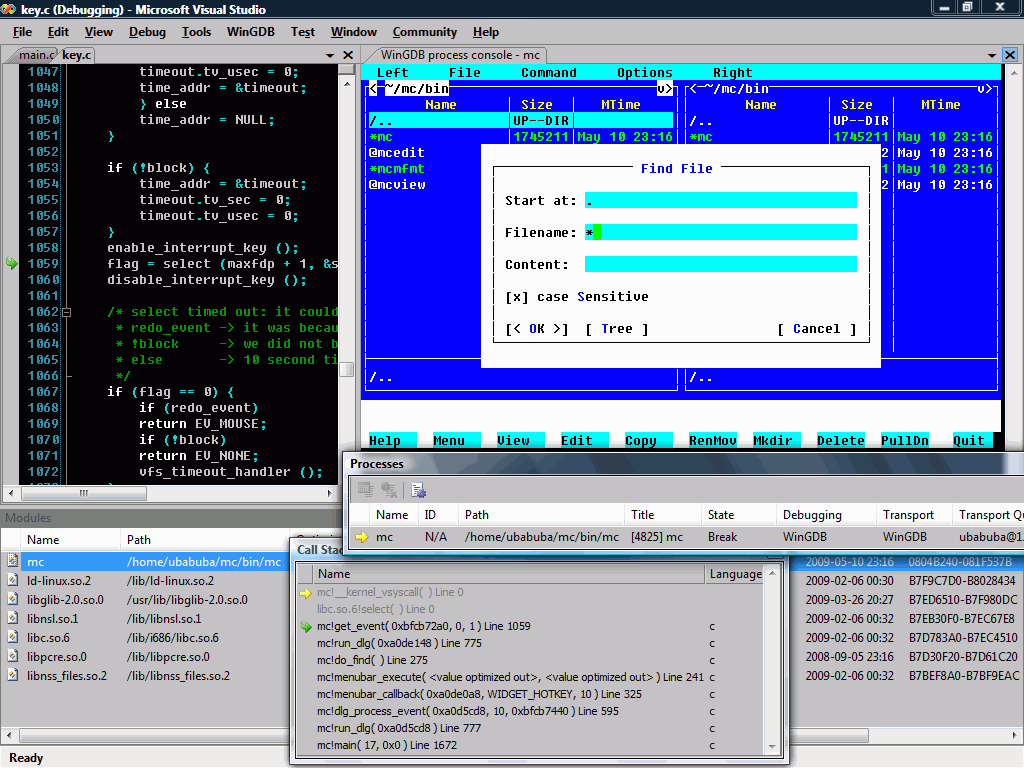
WinGDB Release

- Developer: WinGDB.com
- Home page: www.wingdb.com
- License type: Commercial
- Size: 13.23 MB
- Download
Review
WinGDB is an extension for Visual Studio IDE allowing to debug processes on remote machines running Linux (or other Unix systems) or local machines (built with use of MinGW tools), using native Visual Studio debugging user interface. Features An Add-In for the Visual Studio IDE providing integration with the VS debugger interface. Remote connection to the target machine over SSH. Support for the GDB debugger as a backend (support for other debuggers is planned for the future). MinGW support. Embedded systems support. The "Attach to process" dialog extension allowing attaching to remote processes with GDB. The "Launch process" command, allowing to launch remote processes inside GDB. The "Examine core dump" command, allowing to examine core dump inside GDB. Remote build - run makefile (it may be any command) on remote machine. The output of compiler/linker dumps to VisualStudio Console/Task-Window. Remote source code browsing in the Visual Studio editor. The files are fetched as needed using SCP protocol and cached over a session. Remote edition of the source code in the Visual Studio editor. Edited file is automatically sent back to the target machine after saving it. Basic debugger commands: Run, Step over/into/out, Break All, Continue, Run to cursor, Set Next Statement. Breakpoint setting in remote source files browsed locally. Breakpoint setting by function name or through call-stack window. Additional breakpoint properties: conditions, hit counting, temporary disabling. Data breakpoints. Call stack window. Watch window. Auto / Locals window. Processes window. Modules window. Threads window. Memory window. Registers window. Signals window. Disassembler view. Console window for debugged process I/O, emulating a XTerm terminal. Generating core dump. Follow fork mode for debugging daemons.