RadarCube OLAP Chart Windows Forms
- Category
- Programming
- Components and Libraries

- Developer: Radar-Soft, L.L.C.
- Home page: www.radar-soft.com
- License type: Commercial
- Size: 29.28 MB
- Download
Review
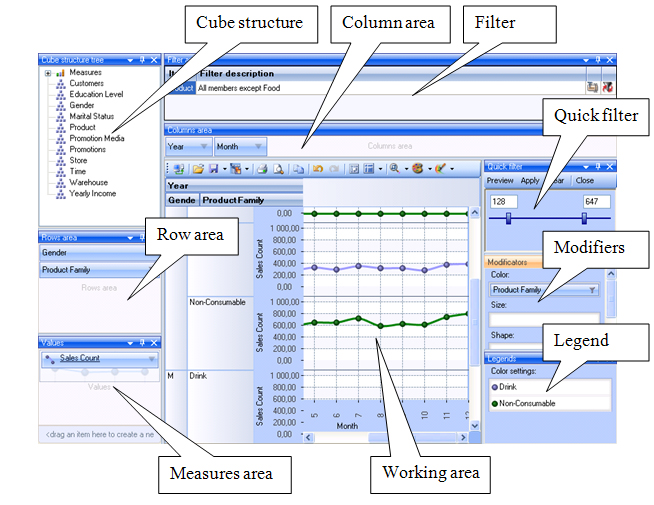
.NET Windows Forms OLAP control to add Visual Analysis to your applications. Displays business data in charts and graphs rather than in numbers. Gives users a unique opportunity to analyze their business data visually and spot new trends and discover unknown problems in their data flow. - Data Source: Construct your visual data representation cube from a relational database or from MS Analysis Services. - Save Reports in file: Save your report and distribute it to another person by network or email. - Filters, Groups, and Sorting: Select what data you want to see and what you don't. Powerful filters to anything including hierarchy members and measure values. - Modifiers support: Show you data in different colors, shapes, and sizes, and so distinguish them in a single graph. - Shapes: Assign any hierarchy a specific shape selected from a wide available range. - Discrete Gradients: Set the ranges of values displayed in selected colors. - Zooming: Take a deeper look at a certain data square by zooming the OLAP Chart. - Look and Feel: Set up the look and feel of the application with a standard color scheme like MS Office 2003, Windows Vista, etc. - Copy to Clipboard: Select any data range in OLAP Chart and pass it to another application like Microsoft Office. - Dockable Panels: Organize your aspects of analysis into your own working space. - Unstructured Data Analysis: Create a multidimensional model for a flat dataset and analyze any unstructured data source. - Printing capabilities: Print your reports or export to a wide range of formats including PDF, XLS, CSV, JPG, etc. - Calculated members: Provide additional information to the hierarchy structure. This may be SubTotals, Intermediate Values, Expected Values, Moving Averages, and the like. - MS Analysis advantages: Use such features of MS Analysis Cubes like KPI (Key Performance Indicators), Time Intelligence, Actions, Translations, Drillthrough, Writeback.