Perfect Widgets for Windows 8
- Category
- Programming
- Components and Libraries

- Developer: Perpetuum Software
- Home page: www.perpetuumsoft.com
- License type: Commercial
- Size: 3.46 MB
- Download
Review
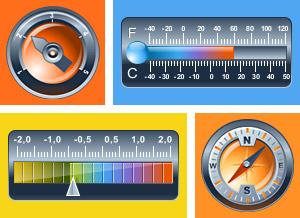
Perfect Widgets for WinRT offers 150+ gauges designed to work in JavaScript based applications for Windows 8. Critical data can be visualized as horizontal, vertical, radial and numeric gauges including thermometers, tanks, LEDs, digits, knobs, odometers, and many more. Developers can adjust existing gauges in the visual designer: remove and add any gauge element, edit color, fill, size, position, font and other properties of the selected gauge element. Complicated gauge behavior is set in short scripts and bindings. It's also possible to build a data visualization control addressing any end user's requirements from scratch. Created gauges are integrated into HTML with just a couple of mouse clicks and are ready for use in Windows 8 HTML5-based applications. Perfect Widgets controls are absolutely interactive and can respond to user actions, i.e. change of pointer and slider value. Developers can get notifications about changes of the gauge value and handle it in JavaScript making gauge react to the slightest change. Indicators perform smooth animation while gauge value changes. Though, gauge animation is customizable as well: it's possible to set simple or advanced animation or disable it at all. Perfect Widgets can gauge any data staring from simple metrics such as weather, speed, duration, temperature, etc. and ending with some industry-specific information such as region sales comparing to total sales, airplane horizon or altitude display, SCADA metrics, etc. In other words they can be used in any industries: medicine and pharmaceutical, chemical and aerospace. Try Perfect Widgets and add compelling data visualizations to your Windows 8 applications!