Nextwave Software WPF Suite with Chart and Gauge
- Category
- Programming
- Components and Libraries
- Developer: Nextwave Software
- Home page: www.nextwavesoft.com
- License type: Commercial
- Size: 13.92 MB
- Download
Review
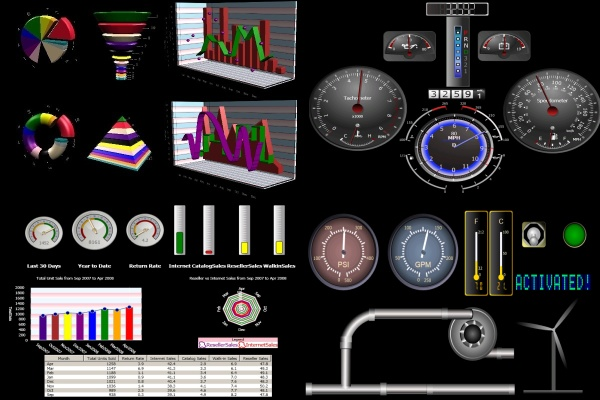
Nextwave Software WPF Suite with WPF Chart and Gauge is a component suite that helps you to visualize your data in Windows Presentation Foundation applications. The suite contains more than 40 2D/3D charts, such as area, bar, column, line, pie, doughnut, pyramid, funnel, scatter, bubble, stock bars, candlesticks and radar charts and circular gauge, linear gauge, digital labels, analog rolling labels, switch and LED. Chart features includes axis scaling, secondary axis, major and minor gridlines and ticks, labels, stripes, margin, legend, annotation, theme, data and control template, title, animation, marker and tooltips. Nextwave WPF Chart supports data binding from XML, Object, Collection, Data Source, XY-Formula and Real Time binding. The layout of chart and gauge are flexible and you can change the style as you like. There are five attractive defined themes for your favorable chart appearance. The suites come with completed user documentation, extensive sample browser with completed code. The source codes are complied with .NET framework and can be used with C#, VB.NET, and Managed C++ as well as other languages which use .NET Framework. With both chart and gauge in Nextwave Software WPF Suites, you can visualize your data in a dashboard for any Business, Manufacturing, or Simulation applications.