MicroCharts
- Category
- Business
- Applications

- Developer: BonaVista Systems
- Home page: www.bonavistasystems.com
- License type: Commercial
- Size: 488 KB
- Download
Review
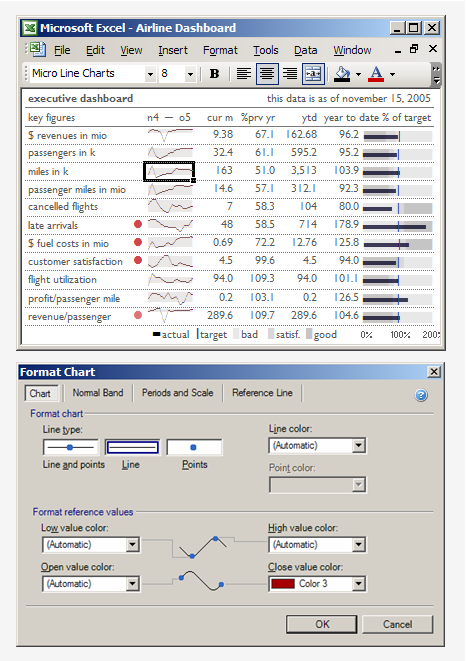
MicroCharts delivers an intuitive Excel add-in allowing you to create richer, more concise reports and dashboards with more information per square inch. Using the latest techniques in dashboard reporting, MicroCharts helps you generate data-rich tables and graphs as small as the size of words. This clear and simple presentation helps business professionals quickly zoom in on positive developments, potential trouble and other rising trends in their data so that they can ultimately make better business decisions. So many charts! MicroCharts offers six dynamic chart types, including columns, lines, win/lose, bar, pie and bullet graphs in a compact, word-sized format. Since the charts are font-based, you can change their size and color - or even copy and paste them into Word - as you would normal text. In addition to delivering high-quality screen images, printouts and PDFs, MicroCharts can also be converted to images for further use in virtually any other computer program. So easy to make! Why waste hours fiddling around in Excel, when you can create MicroCharts in seconds! MicroChart's formatting interface is so clear and simple that even occasional users can quickly produce the desired results. So what are you waiting for? MicroCharts provides a fast, easy way to build rich word-sized reports and dashboards in Microsoft® Excel and Microsoft® SQL Server Analysis Services. Distinguished as the award winner of the BI Network's 2006 Data Visualization Competition for dashboard design, MicroCharts starts as low as $49 for the Basic Edition. For more information and a free thirty-day trial version, visit us online at www.bonavistasystems.com. Technical features: * Microsoft Excel and Analysis Server chart formulas * Excel PivotTable support * In-cell charts available as text or bitmap * Excel XP and Excel 2003 support; Excel 2007 soon available * Line, column, pie and bar charts and bullet graphs