LightningChart Ultimate SDK
- Category
- Programming
- Components and Libraries

- Developer: Pasi Tuomainen
- Home page: www.arction.com
- License type: Commercial
- Size: 264 B
- Download
Review
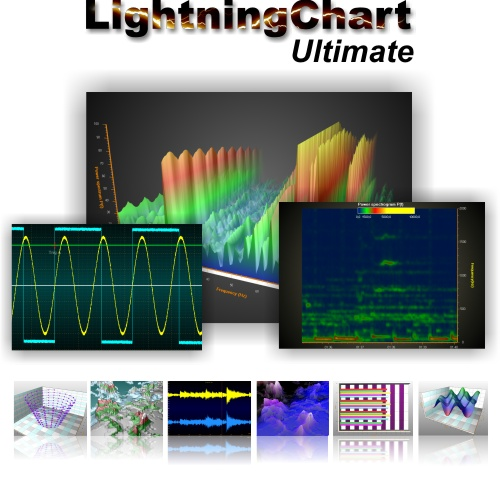
LightningChart Ultimate is the fastest 2D and 3D measurement, engineering and research data visualization SDK for .NET and Windows. LightningChart Ultimate is entirely GPU accelerated (Direct3D) and performance optimized data visualization control for presenting masses of data in 2D graph view, 3D view and polar views. LightningChart Ultimate's graph view is especially designed for professional high-speed data acquisition software, PC-based oscilloscopes and signal analyzers, scientific research, medical and other real-time measurement and signal monitoring applications. The graph is optimized for high-speed sampled signal data handling with innovative CPU overhead saving techniques enabling handling of huge data point amounts, where all other chart/graph controls get delayed, frozen or crashed. Key properties * XY graph view, 3D view and Polar view * Draws huge amounts of measured data as graphs in real-time, very smoothly, up to hundreds of millions of new data points / sec. * High refresh rate even with heavy load * Renders vast data sets instantly * Full 64-bit support. Utilizes over 2 GB memory (in 64-bit systems). * Various series types: sampled data (discrete signal), point-lines, freeform point-lines, bars, bands, constant lines, 3D point-lines, 3D bars, 3D surface mesh, 3D surface grid, 3D waterfall, polar areas, polar point-lines * Gigantic 3D surface sizes of over 2000x2000. * Height/Toned/Point coloring for 3D surfaces and waterfall * Contour lines and wireframing for 3D surfaces and waterfall * Many lighting and shading options for 3D * Perspective and orthographic 3D camera, with pre-defined setups * Built-in series tracking cursors