KPI (Key Performance Indicator) Column
- Category
- Programming
- Components and Libraries

- Developer: ArtfulBits Inc.
- Home page: www.artfulbits.com
- License type: Commercial
- Size: 1.71 MB
- Download
Review
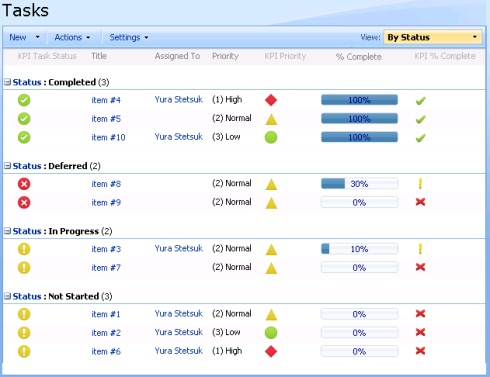
KPI (Key Performance Indicator) column provides users with the ability to define and measure progress toward predefined goals and display current status by using easy-to-understand graphical indicators. Using of KPI provides with ability to visualize answers to the following questions: 1. What am I ahead or behind on? 2. How far ahead or behind am I? 3. What is the minimum I have completed? Components use MOSS 2007 KPI idea, but with reworked functionality. Unlike MOSS 2007 KPI, ArfulBits KPI could be added to any custom list as a column, can use both List View and List Item as data source and supports different indicator icons: flags, traffic lights, shapes, marks and other. You can use traffic light icons to indicate that predefined satisfaction is exceeding, meeting, or failing to meet goals. If predefined satisfaction exceeds a preset goal, the KPI is displayed with a green traffic light icon. If customer satisfaction is failing to meet minimum goals, the customer's satisfaction KPI is displayed with a red traffic light icon. Otherwise, it is displayed with a yellow traffic light icon. Features: - Displaying indicator for each individual item in list using standard SharePoint calculated formulas - Calculating value by using data of associated SharePoint list (a count of items in the list; a computing of Total, Average, Maximum, or Minimum of a numerical column in the list) - Column customization (multiple icons set; text customization; different column display modes) - Predefined set of site columns (KPI Issue Status, KPI Priority, KPI Task Status, KPI % Complete) - AJAX support enabled Why ArtfulBits KPI Column? ArtfulBits KPI (Key Performance Indicator) column is simple graphical scorecards that can be used to evaluate business data against business goals. With this column you reduce the risk to overlook the information about the status of the value, the column take the trouble.